Old Maps of Empire Acres, California for Academic Research
Study the evolution of Empire Acres with 19 high-resolution historic maps. Whether you're teaching, researching, or modeling changes in land use, these maps provide essential visual documentation of urban, environmental, and geographic change.
- Analyze long-term change: Track patterns in development, transportation, and natural features.
- Ideal for environmental or urban studies: Support academic projects with primary historical map data.
- Use in the classroom or lab: Educators and researchers rely on these maps to bring historical context to life.
These maps are a powerful tool for teaching, research, and visualizing how Empire Acres has changed over the decades.
Empire Acres, CA maps
(19)- 1902 Map of Santa Cruz
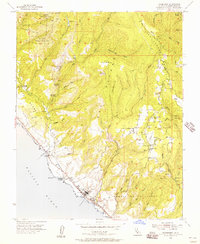
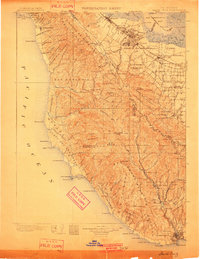 1902 Santa Cruz1902 Print · USGSCoastal California at the end of the Victorian era reveals a landscape of redwood forests, early university towns, and remote Pacific outposts. Genealogists and historians can trace the early rail corridors through Boulder Creek and Felton or locate coastal landmarks like Pigeon Point and Halfmoon Bay.9 unique versions available
 - 1947 Map of San Francisco, 1948 Print
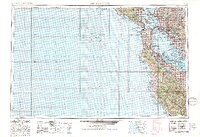
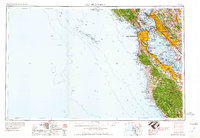
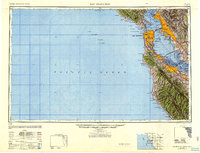 1947 San Francisco1948 Print · USGSThe Bay Area in the late 1940s reveals a region transitioning from wartime intensity to post-war suburban growth. Trace the historic rail lines of the Southern Pacific RR or locate early military footprints at Fort Funston and Moffett Field.
 - 1948 Map of San Francisco, 1951 Print
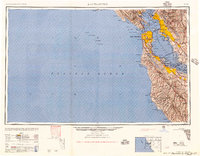
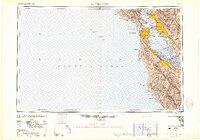 1948 San Francisco1951 Print · USGSThe Bay Area in the late 1940s reveals a landscape defined by rapid post-war growth and a heavy military presence at the Golden Gate. Trace the development of early trans-bay infrastructure like the Oakland-Bay Bridge and historic coastal defense sites such as Fort Funston and Alcatraz Island.
 - 1955 Map of San Francisco
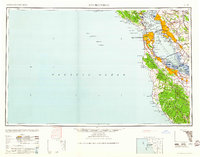
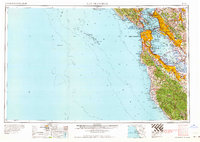
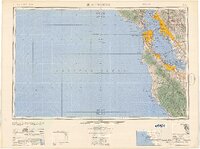 1955 San Francisco1955 Print · USGSThe San Francisco Bay Area and central coast are captured during the postwar boom as suburbs and infrastructure expanded rapidly. Trace the development of local communities and military installations like the Presidio and Fort Mason, or follow the Southern Pacific rail lines.
 - 1955 Map of Davenport, 1957 Print
 1955 Davenport1957 Print · USGSThe Santa Cruz coast and the steep ridges of Ben Lomond Mountain are captured here during the mid-fifties. Researchers can trace the industrial footprint of the Cement Plant in Davenport or locate rural landmarks like Seaside School and Bonnie Doon School.6 unique versions available
 - 1956 Map of San Francisco
 1956 San Francisco1956 Print · USGSThe San Francisco Bay Area is captured in the mid-fifties, showing a landscape of rapid post-war growth and massive military installations. Researchers can trace the sprawling rail lines of the Southern Pacific and locate historic sites like Stanford University or the Hunters Point Naval Shipyard.4 unique versions available
 - 1957 Map of San Francisco
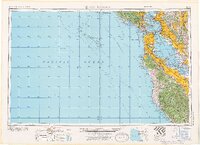
 1957 San Francisco1957 Print · USGSThe Bay Area in the mid-fifties reveals a rapidly growing metropolitan landscape connected by its iconic spans and rail networks. Researchers can trace the layout of military sites like the Presidio and the extent of the Southern Pacific and Western Pacific railroads.
 - 1960 Map of San Francisco
 1960 San Francisco1960 Print · USGSThe San Francisco Bay Area at the start of the sixties reveals a landscape of rapid expansion and critical infrastructure. Researchers can trace the development of East Bay communities like Russell City and Mt Eden or locate early rural landmarks like Alpine School.
 - 1961 Map of San Francisco
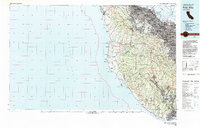
 1961 San Francisco1961 Print · USGSThe Bay Area at the dawn of the 1960s reveals a landscape of growing cities and massive Cold War military installations. Genealogists and historians can trace the mid-century urban footprint from Berkeley to San Mateo, while locating landmarks like the Presidio, Alcatraz Island, and Moffett Field Air Station.
 - 1964 Map of San Francisco
 1964 San Francisco1964 Print · USGSThe Bay Area in the mid-sixties shows a region of rapid suburban expansion and major military installations. Researchers can trace the development of the South Bay near Stanford University or locate family plots in the historic Cypress Lawn Cem and Holy Cross Cem.
 - 1971 Map of San Francisco
 1971 San Francisco1971 Print · USGSThe San Francisco Bay Area at the start of the 1970s is shown here as a dense network of aerospace hubs, naval bases, and expanding suburbs. Researchers can trace the mid-century footprint of Stanford University, the industrial Salt Evaporators, and the Southern Pacific rail lines.
 - 1982 Map of Palo Alto, 1983 Print
 1982 Palo Alto1983 Print · USGSThe Santa Cruz Mountains and the Peninsula's bayshore are captured here in the early eighties as tech-driven growth reshaped the valley. Researchers can trace the sprawling grounds of Stanford University or explore coastal landmarks like the Pigeon Point Lighthouse.2 unique versions available
 - 1985 Map of San Francisco, 1989 Print
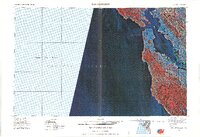 1985 San Francisco1989 Print · USGSThe Bay Area is captured in the mid-1980s through experimental Landsat satellite imagery, offering a unique technological perspective of the California coast. Trace the urban boundaries of San Francisco and Alameda against the San Francisco Bay and Lorenzo.
 - 1991 Map of Davenport, 1995 Print
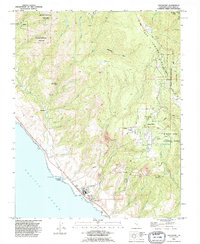 1991 Davenport1995 Print · USGSCoastal Santa Cruz County comes into focus during the early nineties, showing a landscape defined by redwood forests and industrial heritage. Trace the infrastructure of the Cement Plant at Davenport or explore the winding mountain roads near Bonny Doon and Swanton.
 - 1997 Map of Davenport, 1999 Print
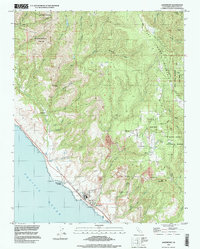 1997 Davenport1999 Print · USGSThe Santa Cruz coast and redwood highlands are captured here in the late nineties, featuring the industrial hub at Davenport. Researchers can trace the inland ridge settlements of Bonny Doon and the historical site of the Big Creek Powerhouse.
 - 2012 Map of Davenport, 2012 Print
 2012 Davenport2012 Print · USGSCovers Empire Acres, including Santa Cruz, Bird Streets, and other nearby areas
 - 2015 Map of Davenport, 2015 Print
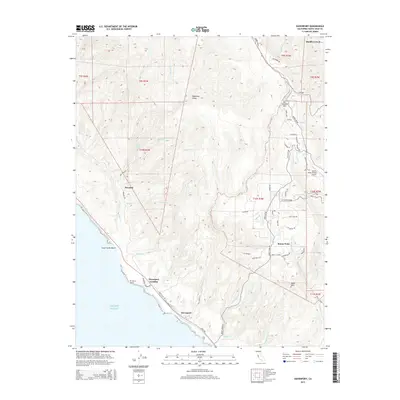 2015 Davenport2015 Print · USGSCovers Empire Acres, including Santa Cruz, Bird Streets, and other nearby areas
 - 2018 Map of Davenport, 2018 Print
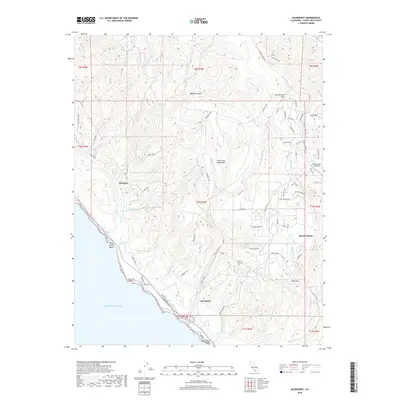 2018 Davenport2018 Print · USGSCovers Empire Acres, including Santa Cruz, Bird Streets, and other nearby areas
 - 2021 Map of Davenport, 2021 Print
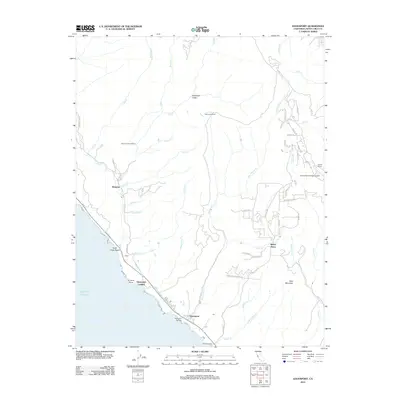
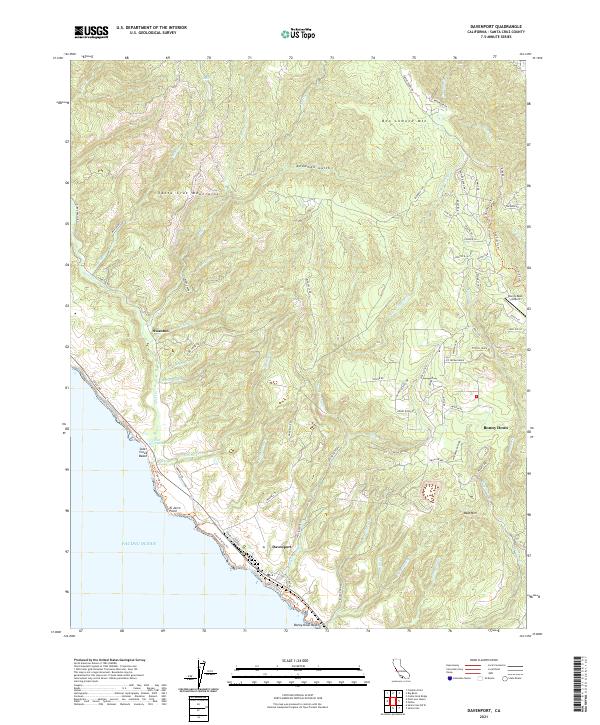 2021 Davenport2021 Print · USGSThe Santa Cruz coastline near Davenport is captured in 2021, showing the area's mix of coastal bluffs and mountain ridges. Trace the modern layout of Bonny Doon and find landmarks like Bonny Doon Airport and Scott Creek Marsh.
End of results
Showing maps 1-19 of 19
Top cities near Empire Acres
- San Jose historical maps
- Palo Alto historical maps
- Santa Cruz historical maps
- Cupertino historical maps
- Campbell historical maps
- Los Gatos historical maps
See more
Frequently asked questions
- What are the different types of historical maps available for Empire Acres?
- What is the oldest map of Empire Acres?
- Where can I purchase historical maps of Empire Acres for my home or office?
- Where can I download high-res historical maps of Empire Acres?
- Are there historical topographic maps available for Empire Acres?
- Is there historical aerial imagery available for Empire Acres?
- Where are historical maps of Empire Acres sourced from?