Old Maps of Vanderbilt, Texas for Academic Research
Study the evolution of Vanderbilt with 11 high-resolution historic maps. Whether you're teaching, researching, or modeling changes in land use, these maps provide essential visual documentation of urban, environmental, and geographic change.
- Analyze long-term change: Track patterns in development, transportation, and natural features.
- Ideal for environmental or urban studies: Support academic projects with primary historical map data.
- Use in the classroom or lab: Educators and researchers rely on these maps to bring historical context to life.
These maps are a powerful tool for teaching, research, and visualizing how Vanderbilt has changed over the decades.
Vanderbilt, TX maps
(11)- 1952 Map of Lolita, 1953 Print
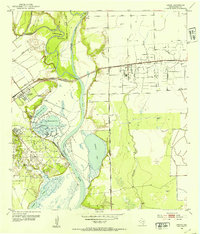 1952 Lolita1953 Print · USGSCoastal Jackson County in the early fifties shows a landscape of river confluences and emerging oil production. Genealogists and industrial historians can trace the rail junction near Lolita and Vanderbilt, or locate family sites near Lolita Cem and the extensive Oil Field.3 unique versions available
 - 1953 Map of Beeville
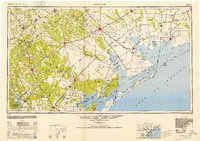 1953 Beeville1953 Print · USGSThe Texas Coastal Bend in the early fifties shows a landscape of growing regional hubs and vital maritime corridors. Trace the rail-and-river economy through Goliad, locate the Matagorda Lighthouse, and explore the sprawling Aransas National Wildlife Refuge.
 - 1956 Map of Beeville
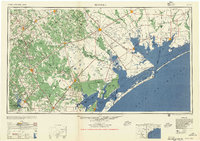 1956 Beeville1956 Print · USGSCoastal Texas and the brush country interior are shown in the mid-fifties, from the coastal bays to the inland oil fields. Trace the old rail lines of the Southern Pacific RR or locate the historic Matagorda Lighthouse and the Aransas National Wildlife Refuge.2 unique versions available
 - 1960 Map of Beeville
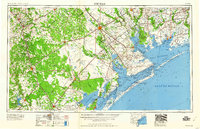 1960 Beeville1960 Print · USGSCoastal Texas in the mid-fifties reveals a landscape of growing towns and vital military outposts like Foster AFB. Researchers can trace old rail lines including the Missouri Pacific and explore the vast Aransas National Wildlife Refuge.
 - 1984 Map of Port Lavaca
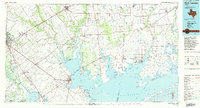 1984 Port Lavaca1984 Print · USGSCoastal Texas in the mid-1980s reveals a landscape of industrial waterways and historic rail corridors. Genealogists and historians can trace family roots through settlements like Bloomington and La Ward or explore the transit networks of the Southern Pacific and Missouri Pacific.
 - 1995 Map of Lolita
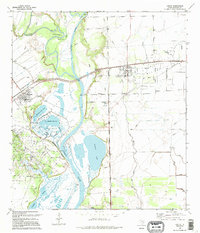 1995 Lolita1995 Print · USGSJackson County's coastal plains are captured in the 1990s at the meeting of the Lavaca River and Navidad River. Researchers can trace the industrial footprint of the Lolita Oil and Gas Field and locate family landmarks like Lolita Cem or the town of Vanderbilt.
 - 2010 Map of Lolita, 2010 Print
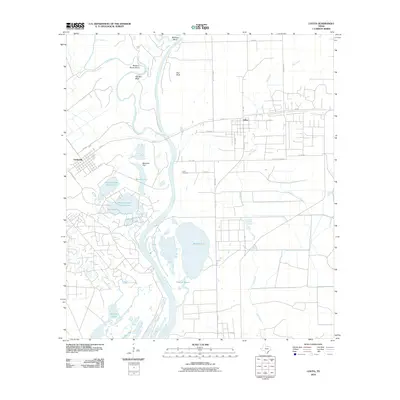 2010 Lolita2010 Print · USGSCovers Vanderbilt, including Lolita, Jackson County, and other nearby areas
 - 2013 Map of Lolita, 2013 Print
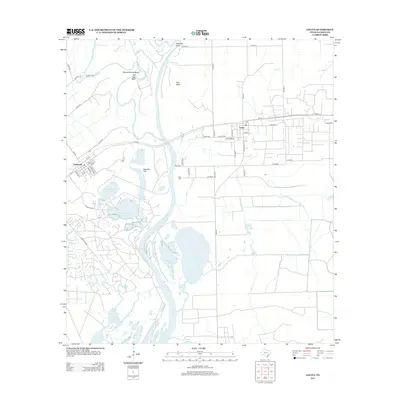 2013 Lolita2013 Print · USGSCovers Vanderbilt, including Lolita, Jackson County, and other nearby areas
 - 2016 Map of Lolita, 2016 Print
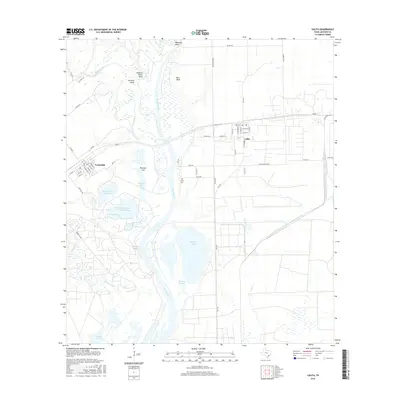 2016 Lolita2016 Print · USGSCovers Vanderbilt, including Lolita, Jackson County, and other nearby areas
 - 2019 Map of Lolita, 2019 Print
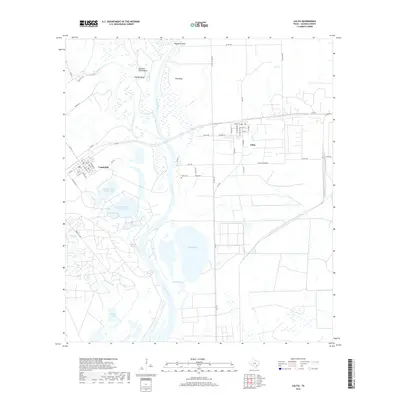 2019 Lolita2019 Print · USGSCovers Vanderbilt, including Lolita, Jackson County, and other nearby areas
 - 2022 Map of Lolita, 2022 Print
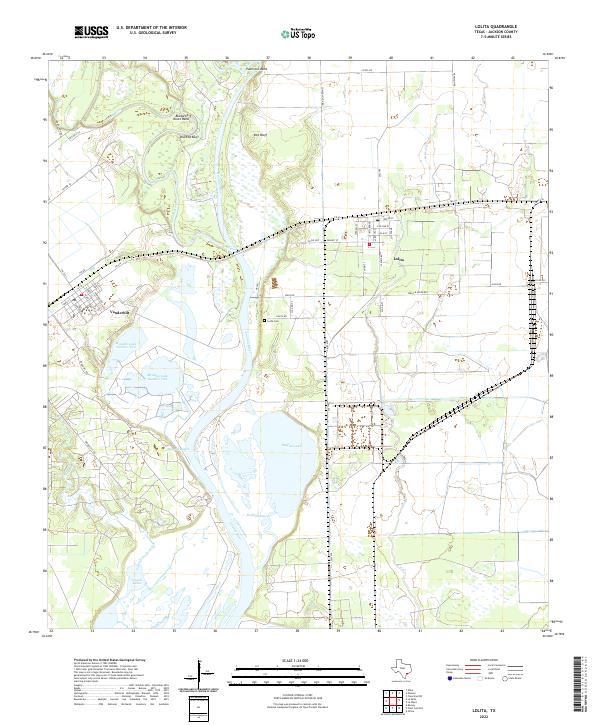 2022 Lolita2022 Print · USGSCoastal Jackson County is captured here in the early 2020s, centered on the strategic junction where the Lavaca River and Navidad River meet. Researchers can trace the layout of Vanderbilt and Lolita, or locate family sites near Lolita Cem and Old Red Bluff.
End of results
Showing maps 1-11 of 11
Top cities near Vanderbilt
- Port Lavaca historical maps
- Edna historical maps
- Ganado historical maps
- Point Comfort historical maps
- La Ward historical maps
Frequently asked questions
- What are the different types of historical maps available for Vanderbilt?
- What is the oldest map of Vanderbilt?
- Where can I purchase historical maps of Vanderbilt for my home or office?
- Where can I download high-res historical maps of Vanderbilt?
- Are there historical topographic maps available for Vanderbilt?
- Is there historical aerial imagery available for Vanderbilt?
- Where are historical maps of Vanderbilt sourced from?