Old Maps of Ochiltree County, Texas
Explore 131 old maps of Ochiltree County, spanning from 1954 to today. These high-resolution historic maps reveal how streets, neighborhoods, landmarks, and natural features evolved over time — perfect for genealogy, metal detecting, research, and local history exploration.
What you can do with these maps:
- See how Ochiltree County changed over time: Compare historical maps to modern-day views to trace roads, homesites, rail lines & more.
- View detailed metadata: Each map includes creators, publishers, year, scale, and archive source.
- Overlay maps with satellite & LiDAR: Visualize the past alongside modern tools to explore terrain & human change.
- Trusted historical sources: Maps sourced from the USGS, Library of Congress, and other archives.
- Access maps your way: View online, download high-res files, or order prints for personal or research use.
Start exploring old maps of Ochiltree County to uncover forgotten places, hidden landmarks, and the deep history beneath your feet.
Ochiltree County, TX maps
(131)- 1954 Map of Perryton, 1966 Print
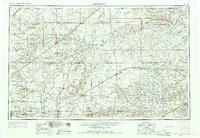 1954 Perryton1966 Print · USGSThe High Plains of the Texas and Oklahoma panhandles are shown during a period of steady growth in the mid-1950s. Genealogists and researchers can trace rail history and local landmarks like Panhandle A & M College, Spurlock Chapel, and the isolated Lord Station.3 unique versions available
 - 1958 Map of Perryton
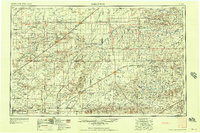 1958 Perryton1958 Print · USGSThe Oklahoma Panhandle and Texas borderlands come alive in this mid-century survey, showing the vital rail-and-ranch economy of the High Plains. Researchers can trace historic stops along the Chicago Rock Island and Pacific and locate rural landmarks like Bethel Church and Spurlock Chapel.
 - 1972 Map of Booker SE, 1976 Print
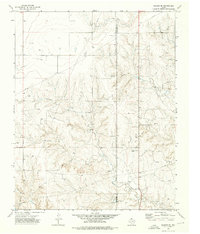 1972 Booker SE1976 Print · USGSThe Texas Panhandle in the early seventies shows an landscape shaped by energy production and prairie drainage. Genealogists and historians can trace the Oil and Gas Field infrastructure alongside local landmarks like Landing Strips and Kiowa Creek.
 - 1973 Map of Booker, 1975 Print
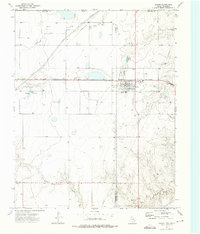 1973 Booker1975 Print · USGSThe high plains town of Booker is captured in the early 1970s, showing a landscape defined by the Atchison Topeka and Santa Fe railroad and energy production. Local researchers can trace family landmarks like Heart Cem, Kiowa Cem, and the Booker Independent Sch.
 - 1973 Map of Farnsworth, 1975 Print
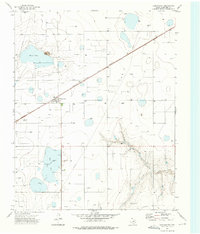 1973 Farnsworth1975 Print · USGSThe Texas Panhandle comes into focus during the early 1970s, showcasing an energy-rich landscape shaped by rail and oil. Researchers can trace the Atchison Topeka and Santa Fe line through Farnsworth and locate numerous Oil Wells and Gas Wells near Truax Lake.
 - 1973 Map of Horseshoe Hill, 1975 Print
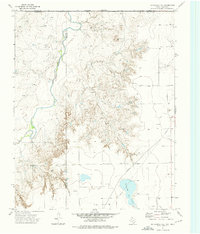 1973 Horseshoe Hill1975 Print · USGSThe Texas Panhandle meets the Oklahoma border in the early 1970s as energy extraction shapes the landscape. Trace the local impact of Gas Wells and Oil Wells near Peckenpaugh Lake and the rural settlement of Hogland.
 - 1973 Map of Booker SW, 1975 Print
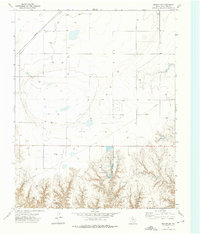 1973 Booker SW1975 Print · USGSThe northern Texas Panhandle appears here in the early 1970s as a hub of energy production and rugged plains terrain. Researchers can trace the intensive petroleum grid through Holdman, locating various Gas Well sites and the deep cuts of Cottonwood Arroyo.
 - 1973 Map of Sourdough Creek NE, 1975 Print
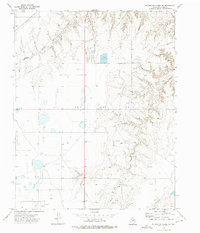 1973 Sourdough Creek NE1975 Print · USGSOchiltree County in the early seventies shows a landscape transformed by the energy industry. Researchers can trace the extensive Oil And Gas Field infrastructure alongside local landmarks like Mc Lain Airport and the waters of Wolf Creek.
 - 1973 Map of Pickett Ranch Creek, 1975 Print
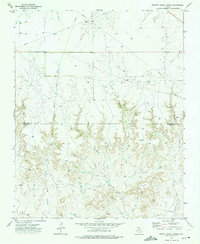 1973 Pickett Ranch Creek1975 Print · USGSThe Texas Panhandle at the height of the 1970s energy boom reveals a landscape dominated by a vast Oil And Gas Field. Trace the network of Pipelines and Oil Wells crossing Pickett Ranch Creek and the Ochiltree Co border.
 - 1973 Map of Perryton SE, 1976 Print
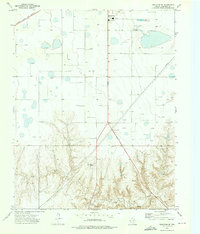 1973 Perryton SE1976 Print · USGSThe Texas Panhandle south of Perryton is captured in the early 1970s as an active hub of petroleum production and cattle country. Researchers can locate the Ochiltree Cemetery and trace the original Atchison Topeka and Santa Fe rail line.
 - 1973 Map of Perryton, 1976 Print
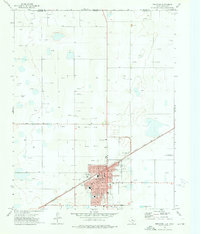 1973 Perryton1976 Print · USGSPerryton served as a vital Texas Panhandle rail and energy hub during the early seventies, positioned just south of the Oklahoma border. Researchers can trace the town's mid-century footprint through the Atchison Topeka and Santa Fe rail line, local schools like Central Jr High Sch, and the vintage Drive-in Theater.
 - 1973 Map of Lake Fryer, 1976 Print
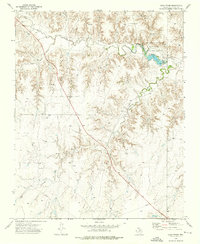 1973 Lake Fryer1976 Print · USGSOchiltree County in the early seventies shows a landscape where energy extraction meets public recreation. Researchers can trace petroleum development via numerous Oil Wells and Gas Well sites, or locate early park infrastructure at Lake Fryer and Wolf Creek County Park.
 - 1973 Map of Waka, 1976 Print
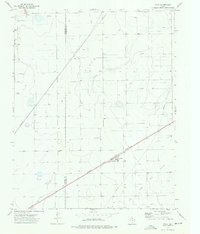 1973 Waka1976 Print · USGSWaka and the surrounding High Plains are captured here in the early 1970s, during a period of intensive energy development. Researchers can trace the Atchison Topeka and Santa Fe rail line, find the Bethel Cem, and locate numerous Oil Well sites.
 - 1973 Map of Barton Creek, 1976 Print
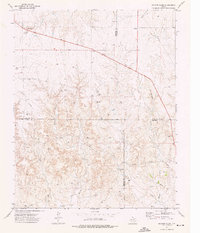 1973 Barton Creek1976 Print · USGSThe northern Panhandle at the height of the 1970s energy boom shows a landscape defined by cattle draws and resource extraction. Trace the industrial development of the four-county corner through Gas Wells, PIPELINES, and a local Pumping Sta along the banks of Barton Creek.
 - 1973 Map of Elmwood, 1976 Print
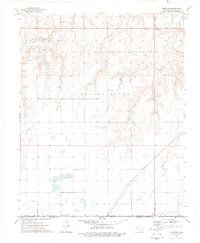 1973 Elmwood1976 Print · USGSThe Oklahoma Panhandle in the early 1970s is defined here by its intersection of major highways and an active energy economy. Family researchers and historians can locate Elmwood, Kirby Cem, and the industrial landscape of the Oil Fields.
 - 1973 Map of Sourdough Creek SW, 1976 Print
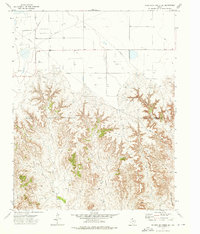 1973 Sourdough Creek SW1976 Print · USGSThe Texas Panhandle at the transition from the early seventies reveals a landscape of industrial extraction and complex drainage. Researchers can trace the network of Oil Well and Gas Well sites or follow the deep terrain of Government Canyon and Jacks Creek.
 - 1973 Map of Spearman NE, 1976 Print
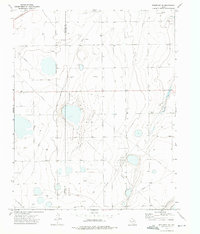 1973 Spearman NE1976 Print · USGSThe Texas Panhandle in the early seventies shows an energy landscape shaped by gas extraction across the Hansford Co border. Local historians and genealogists can trace the rural landscape near Black Cem and the busy network of Gas Wells and pipelines.
 - 1973 Map of Sourdough Creek NW, 1976 Print
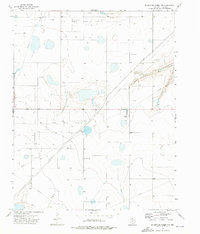 1973 Sourdough Creek NW1976 Print · USGSThe High Plains of the Texas Panhandle are captured in the early 1970s as a hub of energy production. Researchers can trace the infrastructure of a massive Oil and Gas Field and locate a remote Landing Strip and Pumping Sta near Middle Prong Wolf Creek.
 - 1973 Map of Spearman SE, 1976 Print
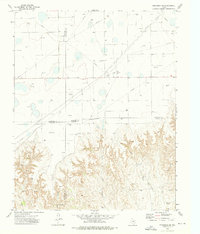 1973 Spearman SE1976 Print · USGSThe Texas Panhandle at the meeting of four counties shows a landscape transformed by the mid-century energy boom. Trace the industrial footprint of the Gasoline Plant and Gravel Pits or follow the deep draws of Pats Creek and Willow Creek.
 - 1973 Map of Lake Fryer NE, 1976 Print
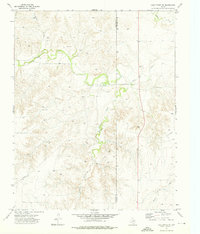 1973 Lake Fryer NE1976 Print · USGSOchiltree County is shown at the height of the mid-century energy boom, where oil and gas infrastructure meets traditional Texas ranchland. Trace the rural landscape along Wolf Creek and Gibson Creek to find isolated Gas Well sites and the local Gravel Pit.
 - 1973 Map of Huntoon, 1976 Print
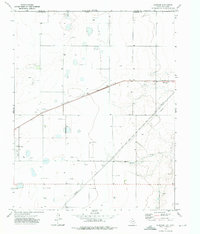 1973 Huntoon1976 Print · USGSThe High Plains of Ochiltree County come alive in the early 1970s as a hub of energy and rail transport. Researchers can trace the Atchison Topeka and Santa Fe rail line through Twichell and Huntoon alongside numerous oil wells and pipelines.
 - 1973 Map of Sourdough Creek, 1976 Print
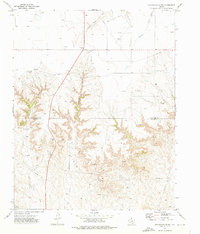 1973 Sourdough Creek1976 Print · USGSThe Texas Panhandle energy landscape comes into focus during the early 1970s along the Ochiltree and Roberts County line. Trace the development of the Oil and Gas Field through features like McLain Airport, a Pumping Sta, and Sourdough Creek.
 - 1973 Map of Perryton NW, 1976 Print
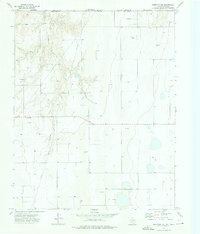 1973 Perryton NW1976 Print · USGSThe Texas-Oklahoma borderlands in the early seventies reveal an industrial landscape shaped by the Oil and Gas Field. Researchers can trace energy infrastructure along Chiquita Creek, including numerous oil wells and isolated Gravel Pits.
 - 1986 Map of Perryton
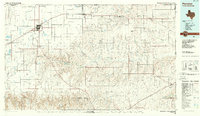 1986 Perryton1986 Print · USGSThe High Plains and canyon breaks of the Texas Panhandle are captured here in the mid-eighties, showing the region's vital energy and rail corridors. Trace the path of the Atchison Topeka and Santa Fe through Perryton and Booker or locate remote rural outposts like Lipscomb and Higgins.
 - 1986 Map of Beaver
 1986 Beaver1986 Print · USGSThe Oklahoma Panhandle is shown in the mid-eighties as a landscape of energy production and resilient prairie settlements. Trace the networks of the Oil and Gas Fields surrounding towns like Beaver, Forgan, and Turpin.2 unique versions available
Showing maps 1-25 of 131
Top cities of Ochiltree County
Frequently asked questions
- What are the different types of historical maps available for Ochiltree County?
- What is the oldest map of Ochiltree County?
- Where can I purchase historical maps of Ochiltree County for my home or office?
- Where can I download high-res historical maps of Ochiltree County?
- Are there historical topographic maps available for Ochiltree County?
- Is there historical aerial imagery available for Ochiltree County?
- Where are historical maps of Ochiltree County sourced from?