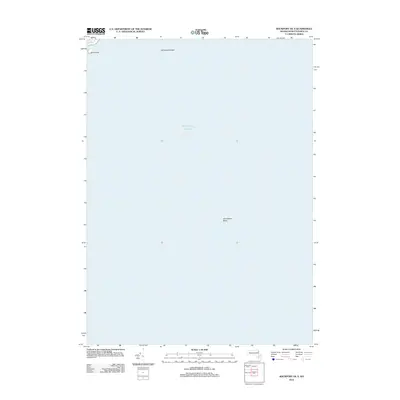
2012 Map of Rockport OE S
USGS Topo · Published 2012About this map
Atlantic Ocean waters dominate this maritime chart, providing a high-resolution look at the submerged topography and coastal outcrops southeast of the Rockport peninsula. While mostly comprised of open sea, the survey captures the hazardous navigational features of the Cape Ann shoreline, specifically the rocky projection of Salt Island and the neighboring Salt Island Ledge. Further offshore, the mapping identifies the significant seafloor rise of Gloucester Bank, an area historically tied to the region's deep-sea fishing heritage. This 2012 record serves as a precise digital capture of these bathymetric and coastal landmarks before shifting coastal dynamics or rising sea levels alter the profile of the North Shore's outer islands.
Find a feature on this map
4 named features on this map. Tap any name to fly to it.
Don’t see what you’re looking for? This feature index may not catch every label — zoom into the map to look around manually.
Map Details
Editions of this 2012 Rockport OE S Map
This is the sole edition of this map. No revisions or reprints were ever made.
Other maps of this area
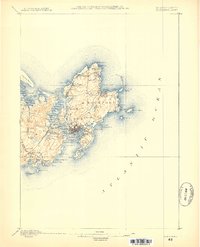
1886 · Gloucester
USGS Topo · 1:62,500
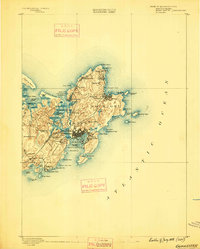
1888 · Gloucester
USGS Topo · 1:62,500
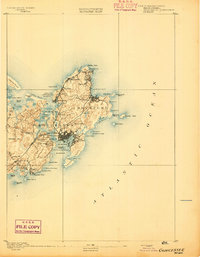
1893 · Gloucester
USGS Topo · 1:62,500
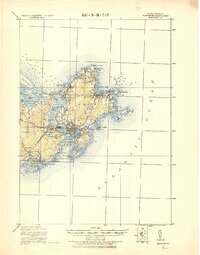
1918 · Gloucester
USGS Topo · 1:62,500
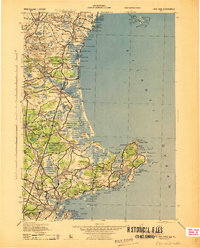
1943 · Cape Ann
USGS Topo · 1:125,000
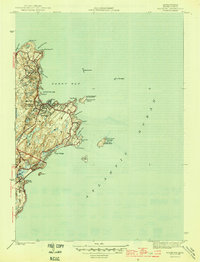
1945 · Rockport
USGS Topo · 1:31,680
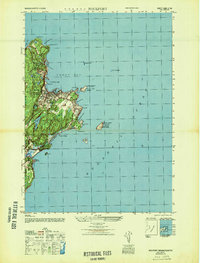
1947 · Rockport
USGS Topo · 1:25,000
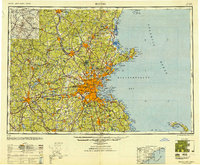
1948 · Boston
USGS Topo · 1:250,000
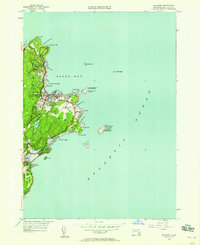
1949 · Rockport
USGS Topo · 1:24,000
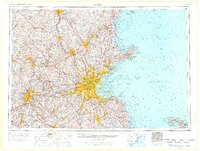
1956 · Boston
USGS Topo · 1:250,000