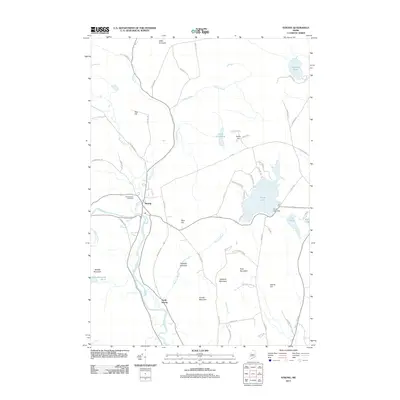
2011 Map of Strong
USGS Topo · Published 2011About this map
The Sandy River winds through the heart of this Franklin County landscape, shaping the development of Strong and South Strong along its banks. This 2011 survey details the transition from the river valley to the surrounding peaks, where the lowland Hartwell Intervale is overlooked by the heights of Hartwell Mountain and Hunter Mountain. The map reveals a high density of water features in the eastern and northern reaches, including the expansive Porter Lake, which is regulated by the Porter Lake Dam, alongside smaller bodies such as Taylor Hill Pond and Gammon Pond.
Find a feature on this map
65 named features on this map. Tap any name to fly to it.
Don’t see what you’re looking for? This feature index may not catch every label — zoom into the map to look around manually.
Map Details
Editions of this 2011 Strong Map
This is the sole edition of this map. No revisions or reprints were ever made.
Other maps of this area
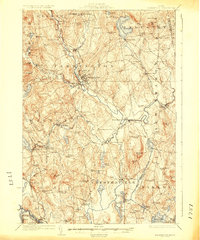
1924 · Farmington
USGS Topo · 1:62,500
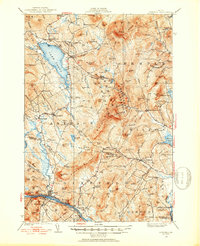
1926 · Dixfield
USGS Topo · 1:62,500
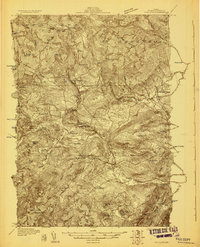
1929 · Phillips
USGS Topo · 1:48,000
1929 · Dixfield
USGS Topo · 1:62,500
1930 · Kingfield
USGS Topo · 1:48,000
1932 · Phillips
USGS Topo · 1:62,500
1932 · Kingfield
USGS Topo · 1:62,500
1950 · Lewiston
USGS Topo · 1:250,000
1956 · Dixfield
USGS Topo · 1:48,000
1956 · Farmington
USGS Topo · 1:62,500