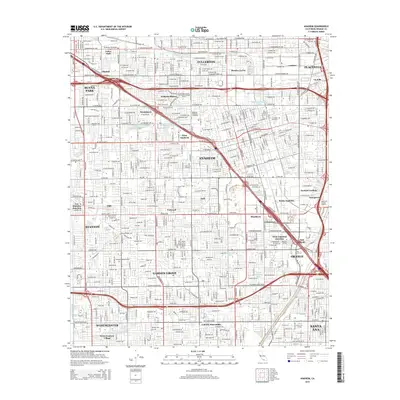
2015 Map of Anaheim
USGS Topo · Published 2015About this map
Anaheim and its surrounding Orange County neighborhoods are depicted here at a point of high density, where residential tracts and commercial centers have largely replaced the citrus groves of the past. The map traces the complex network of flood control measures essential to the region, including the Santa Ana River, Santiago Cr, and a series of specialized basins such as the Crescent Retarding Basin, Gilbert Retarding Basin, and Raymond Retarding Basin. These engineered features illustrate the mid-century urban planning required to manage the coastal plain's hydrology as it transformed into a continuous metropolitan landscape.
Find a feature on this map
156 named features on this map. Tap any name to fly to it.
Don’t see what you’re looking for? This feature index may not catch every label — zoom into the map to look around manually.
Map Details
Editions of this 2015 Anaheim Map
This is the sole edition of this map. No revisions or reprints were ever made.
Other maps of this area
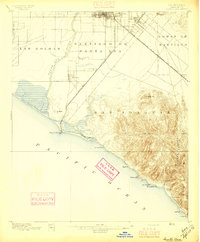
1896 · Santa Ana
USGS Topo · 1:62,500
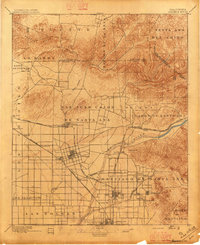
1896 · Anaheim
USGS Topo · 1:62,500
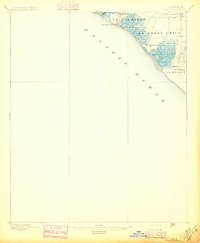
1896 · Las Bolsas
USGS Topo · 1:62,500
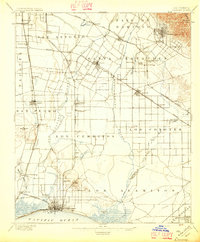
1896 · Downey
USGS Topo · 1:62,500
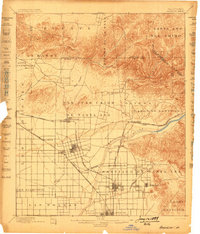
1898 · Anaheim
USGS Topo · 1:62,500
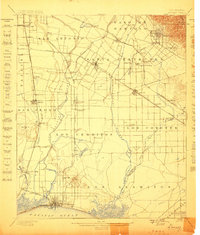
1899 · Downey
USGS Topo · 1:62,500
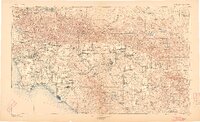
1901 · Southern California Sheet No. 1
USGS Topo · 1:250,000
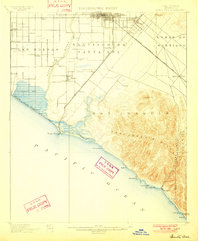
1901 · Santa Ana
USGS Topo · 1:62,500
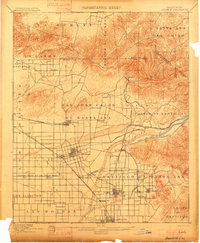
1901 · Anaheim
USGS Topo · 1:62,500
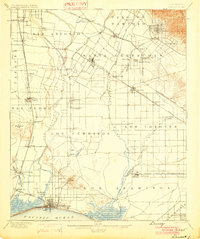
1902 · Downey
USGS Topo · 1:62,500