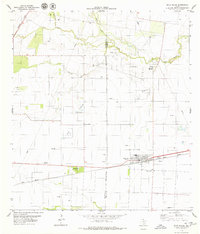
1979 Map of Agua Dulce
USGS Topo · Published 1979About this map
Agua Dulce and Bentonville serve as the primary population centers in this late-1970s landscape defined by an extensive energy infrastructure. The sprawling Agua Dulce Oil Field dominates the central and northern portions of the quadrangle, evidenced by a dense concentration of Oil Wells and a complex network of pipelines. Industrial activity is further highlighted by features such as a Pipeline Terminal and multiple pumping stations scattered across the terrain.
Find a feature on this map
20 named features on this map. Tap any name to fly to it.
Don’t see what you’re looking for? This feature index may not catch every label — zoom into the map to look around manually.
Map Details
Editions of this 1979 Agua Dulce Map
This is the sole edition of this map. No revisions or reprints were ever made.
Other maps of this area
1917 · Ben Bolt
USGS Topo · 1:62,500
1920 · San Diego
USGS Topo · 1:62,500
1950 · Corpus Christi
USGS Topo · 1:250,000
1954 · Orange Grove
USGS Topo · 1:62,500
1954 · Kingsville
USGS Topo · 1:62,500
1956 · Corpus Christi
USGS Topo · 1:250,000
1956 · Laredo
USGS Topo · 1:250,000
1960 · Corpus Christi
USGS Topo · 1:250,000
1963 · San Diego NE
USGS Topo · 1:24,000
1963 · Alice North
USGS Topo · 1:24,000
Featured Places
- Agua Dulce, TX
- Bentonville, TX
- Palo Hueco Estates Colonia, TX
- Harvest Acres Colonia, TX
- Nueces County, TX