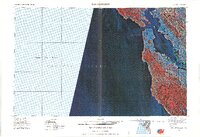
1985 Map of San Francisco
USGS Topo · Published 1989About this map
San Francisco and its surrounding coastal geography are captured in this experimental satellite image map produced using Landsat-5 imagery. The visualization highlights the dense urban core of San Francisco contrasted against the deep blues of the San Francisco Bay and the vast Gulf of the Farallones. This specific edition represents a shift in cartographic technique for the era, utilizing a silver ink overprint for feature names to balance label legibility with the visual integrity of the thematic mapper data. Researchers can observe the mid-1980s urban footprint extending toward Lorenzo and the county boundaries of Alameda, while the western portion of the sheet remains open Pacific Ocean with a designated area where imagery is not shown. The False-color infrared rendering allows for a clear distinction between metropolitan development and the surrounding vegetation patterns of the peninsula.
Find a feature on this map
8 named features on this map. Tap any name to fly to it.
Don’t see what you’re looking for? This feature index may not catch every label — zoom into the map to look around manually.
Map Details
Editions of this 1985 San Francisco Map
This is the sole edition of this map. No revisions or reprints were ever made.
Other maps of this area
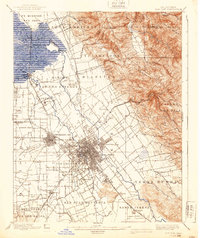
1889 · San Jose
USGS Topo · 1:62,500
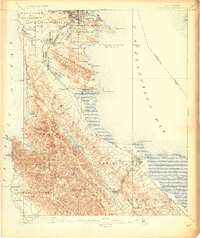
1892 · San Mateo
USGS Topo · 1:62,500
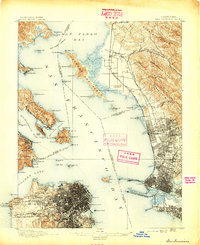
1895 · San Francisco
USGS Topo · 1:62,500
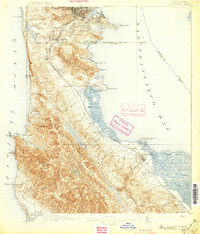
1896 · San Mateo
USGS Topo · 1:62,500
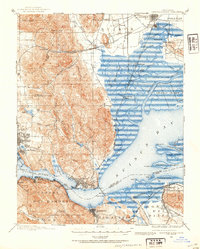
1896 · Carquinez Strait
USGS Topo · 1:62,500
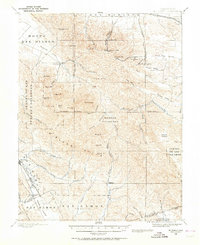
1896 · Mt. Diablo
USGS Topo · 1:62,500
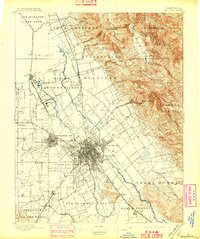
1897 · San Jose
USGS Topo · 1:62,500
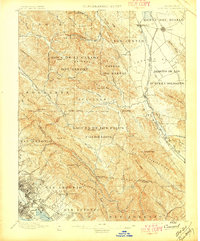
1897 · Concord
USGS Topo · 1:62,500
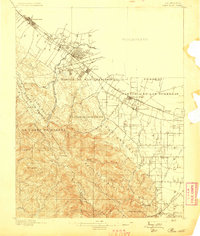
1897 · Palo Alto
USGS Topo · 1:62,500
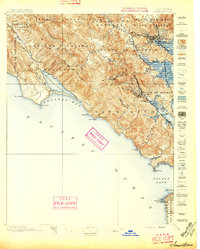
1897 · Tamalpais
USGS Topo · 1:62,500