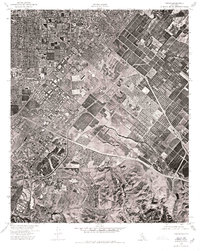
1974 Map of Tustin
USGS Topo · Published 1975About this map
Orange County land use undergoes a massive transition in this 1974 orthophotoquad, which captures the shifting patterns of agriculture and suburban development. The aerial imagery reveals an intricate patchwork of commercial orchards and large-scale agricultural plots as they yield to the expanding residential footprint of Newport Beach and the surrounding plains. The Orange County Board of Supervisors and the U.S. Geological Survey collaborated on this study, documenting the region's precise layout of early master-planned communities, winding suburban streets, and the industrial structures of the time. This visual record provides an unmatched perspective on the spatial history of the county, showing exactly which groves remained and which hillside developments were just beginning to take shape in the mid-1970s.
Find a feature on this map
1 named feature on this map. Tap any name to fly to it.
Don’t see what you’re looking for? This feature index may not catch every label — zoom into the map to look around manually.
Map Details
Editions of this 1974 Tustin Map
This is the sole edition of this map. No revisions or reprints were ever made.
Other maps of this area
1896 · Santa Ana
USGS Topo · 1:62,500

1896 · Anaheim
USGS Topo · 1:62,500
1898 · Anaheim
USGS Topo · 1:62,500

1901 · Southern California Sheet No. 1
USGS Topo · 1:250,000
1901 · Santa Ana
USGS Topo · 1:62,500

1901 · Anaheim
USGS Topo · 1:62,500
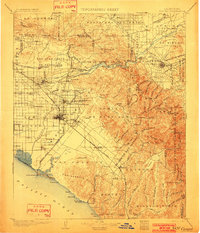
1902 · Corona
USGS Topo · 1:125,000

1904 · Southern California Sheet No. 1
USGS Topo · 1:250,000
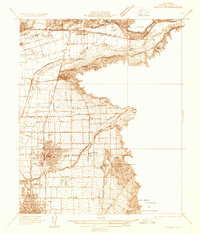
1932 · Orange
USGS Topo · 1:31,680
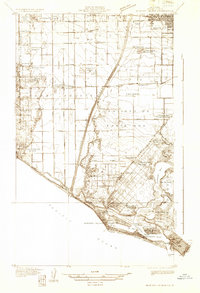
1932 · Newport Beach
USGS Topo · 1:31,680