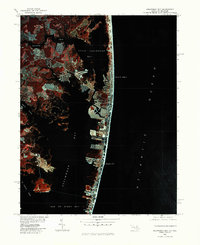
1980 Map of Assawoman Bay
USGS Topo · Published 1982About this map
Fenwick Island serves as a narrow barrier between the high-energy surf of the Atlantic Ocean and the intricate coastal wetlands of the Maryland-Delaware border. This 1980 color infrared orthophotogrammetric study reveals the dense residential and commercial expansion of Ocean City as it stretches northward along the thin peninsula. The imagery provides a stark contrast between the heavy development on the barrier island and the tidal estuaries to the west, including Little Assawoman Bay and the broader reaches of Assawoman Bay. Further inland, the complex hydrology of the region is defined by the Dirickson Creek and the St Martin River, which feed into the northern extent of Isle of Wight Bay. The infrared spectrum highlights the distinction between sandy shorelines, built environments, and the deep vegetative signatures of the mainland marshes and Greys Creek.
Find a feature on this map
9 named features on this map. Tap any name to fly to it.
Don’t see what you’re looking for? This feature index may not catch every label — zoom into the map to look around manually.
Map Details
Editions of this 1980 Assawoman Bay Map
This is the sole edition of this map. No revisions or reprints were ever made.
Other maps of this area
1901 · Ocean City
USGS Topo · 1:62,500
1918 · Rehoboth
USGS Topo · 1:62,500
1938 · Rehoboth
USGS Topo · 1:62,500
1942 · Ocean City
USGS Topo · 1:62,500
1942 · Ocean City
USGS Topo · 1:24,000
1943 · Selbyville
USGS Topo · 1:31,680
1943 · Berlin
USGS Topo · 1:31,680
1943 · Ocean City
USGS Topo · 1:31,680
1943 · Assawoman Bay
USGS Topo · 1:31,680
1943 · Bethany Beach
USGS Topo · 1:24,000