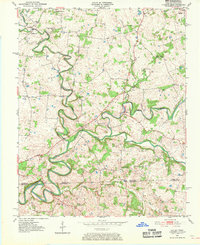
1951 Map of Dot
USGS Topo · Published 1970About this map
The Kentucky-Tennessee border serves as the defining line for this 1951 topographic survey, where the winding waters of Whippoorwill Creek and the Red River carve through the landscape of Logan and Robertson counties. The settlement pattern is defined by small, rural clusters and country crossroads such as Dot and the colorfully named Lickskillet. The density of rural institutions, including Cedar Grove School and a high concentration of community landmarks like Emmanuel Ch and Bethany Ch, suggests a landscape of tight-knit agricultural social centers that were still largely intact at mid-century before more modern rural consolidation. This survey captures the terrain just as aerial photography began to modernize mapping, showing the intricate relationship between the oxbow bends of the South Fork Red River and the small family settlements of Salem and Center Point.
Find a feature on this map
24 named features on this map. Tap any name to fly to it.
Don’t see what you’re looking for? This feature index may not catch every label — zoom into the map to look around manually.
Map Details
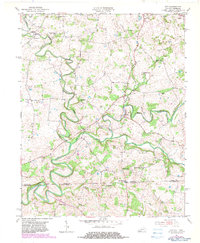
Editions of this 1951 Dot Map
3 editions found
Other maps of this area
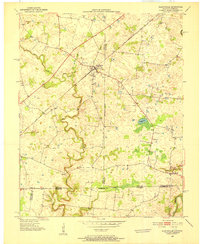
1950 · Allensville
USGS Topo · 1:24,000
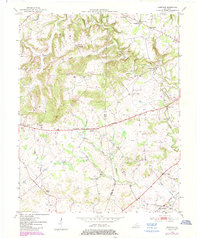
1950 · Olmstead
USGS Topo · 1:24,000
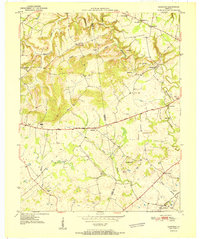
1951 · Olmstead
USGS Topo · 1:24,000
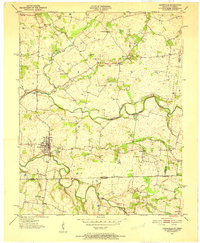
1951 · Adairville
USGS Topo · 1:24,000
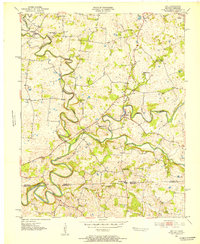
1951 · Dot
USGS Topo · 1:24,000
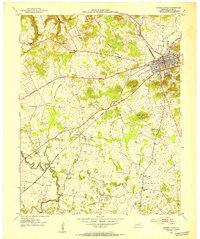
1952 · Russellville
USGS Topo · 1:24,000
1952 · Springfield North
USGS Topo · 1:24,000
1952 · Youngville
USGS Topo · 1:24,000
1952 · Dennis
USGS Topo · 1:24,000
1956 · Nashville
USGS Topo · 1:250,000