1900s (20th Century) Maps of Lipscomb County, Texas
Explore 27 historic maps of Lipscomb County from the 1900s (20th Century). These maps offer a rare glimpse into what life looked like during the 1900s — showing old roads, neighborhoods, homes, and landmarks that have changed or disappeared over time.
Whether you're researching your family's past, planning a metal detecting trip, or studying how Lipscomb County's landscape evolved across the 1900s, these high-resolution maps are a powerful tool for exploring the history of this region.
- Focus on a specific era: All maps on this page are from the 1900s, giving you a focused view of this time period.
- See what’s changed: Compare century-old streets, trails, and buildings to today's modern landscape using overlays and satellite layers.
- Research with precision: Use these maps for genealogy, historical research, land use analysis, or educational projects.
- View, download, or print: Maps are fully viewable online in high resolution, and can be downloaded or printed for your own records.
Start exploring Lipscomb County's history through authentic maps from the 1900s. This is your window into the past.
Lipscomb County, TX maps
(27)- 1954 Map of Perryton, 1966 Print
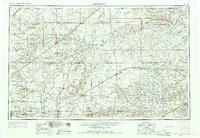 1954 Perryton1966 Print · USGSThe High Plains of the Texas and Oklahoma panhandles are shown during a period of steady growth in the mid-1950s. Genealogists and researchers can trace rail history and local landmarks like Panhandle A & M College, Spurlock Chapel, and the isolated Lord Station.3 unique versions available
 - 1958 Map of Perryton
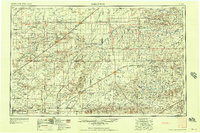 1958 Perryton1958 Print · USGSThe Oklahoma Panhandle and Texas borderlands come alive in this mid-century survey, showing the vital rail-and-ranch economy of the High Plains. Researchers can trace historic stops along the Chicago Rock Island and Pacific and locate rural landmarks like Bethel Church and Spurlock Chapel.
 - 1971 Map of Clear Lake SW, 1973 Print
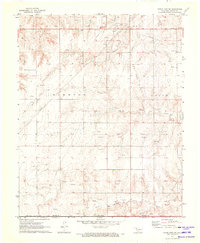 1971 Clear Lake SW1973 Print · USGSBeaver County and the Oklahoma Panhandle are shown at the height of the early 1970s energy boom. Genealogists and local historians can trace rural school sites like Garrett Sch and family burial grounds at Baker Cem or Sophia Cem.2 unique versions available
 - 1971 Map of Clear Lake SE, 1973 Print
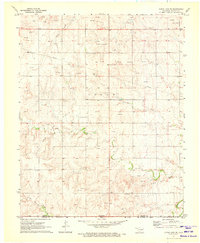 1971 Clear Lake SE1973 Print · USGSBeaver County energy development was in full swing during the early 1970s, as shown by this detailed survey of the Oklahoma panhandle. Researchers can trace the extensive Logan Oil and Gas Field and find scattered landmarks like Midway and Coon Creek.
 - 1972 Map of Barton Corners, 1974 Print
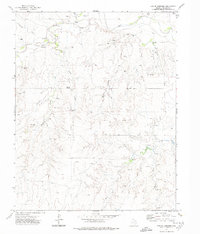 1972 Barton Corners1974 Print · USGSLipscomb County at the start of the 1970s reveals a Panhandle landscape defined by cattle country and a growing energy sector. Researchers can trace the rural community around Park Valley School, the settlement at Barton Corners, and numerous Oil Well sites.
 - 1972 Map of Follett SE, 1974 Print
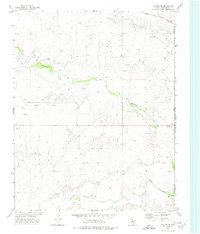 1972 Follett SE1974 Print · USGSThe Texas Panhandle's high plains meet the Oklahoma border in the early seventies, showing a landscape defined by water and energy. Researchers can trace the paths of Mammoth Creek and Wolf Creek or locate industrial sites like the Gravel Pit and scattered Gas Wells.
 - 1972 Map of Dugout Creek, 1974 Print
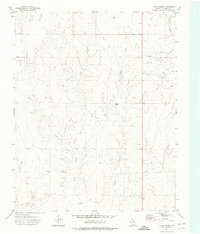 1972 Dugout Creek1974 Print · USGSLipscomb County in the early seventies shows a landscape defined by energy production and deep creek drainages. Researchers can trace the ranching and industrial footprints of Laurie, the Turner School, and the extensive OIL AND GAS FIELD.
 - 1972 Map of Skunk Creek, 1974 Print
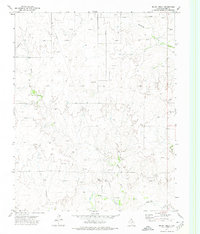 1972 Skunk Creek1974 Print · USGSThe Texas Panhandle meets the border in the early 1970s, where energy infrastructure and ranching define the landscape. Trace the development of the oil fields near Schultz and follow the course of Skunk Creek and Wolf Creek toward the Oklahoma State Line.
 - 1972 Map of Magoun, 1974 Print
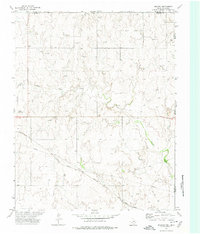 1972 Magoun1974 Print · USGSThe High Plains borderlands of Texas and Oklahoma are captured here in the early 1970s, as energy production and rail transit defined the local economy. Researchers can locate Fairmont Cem, trace the ATCHISON TOPEKA AND SANTA FE railroad, and find the small settlement at Magoun.
 - 1972 Map of Follett, 1974 Print
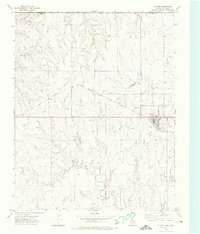 1972 Follett1974 Print · USGSFollett and the northeastern Texas Panhandle are captured here in the early seventies as the local energy economy expanded along the rail lines. Genealogists and historians can trace the town’s development near St Johns Ch, Fairview Cem, and the Atchison Topeka and Santa Fe railroad.
 - 1972 Map of Higgins North, 1974 Print
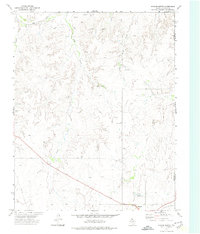 1972 Higgins North1974 Print · USGSThe Texas Panhandle meets the Oklahoma border in the early seventies, centered on the railroad town of Higgins. Researchers can trace the industrial landscape of the plains through numerous Gas Wells, the A T & S F tracks, and the local Cem.
 - 1972 Map of Glazier, 1974 Print
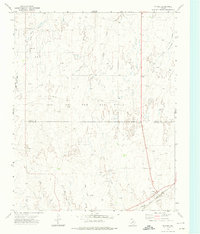 1972 Glazier1974 Print · USGSThe Texas Panhandle's industrial and rail landscape is on display in the early 1970s as the energy sector expands across Hemphill County. Genealogists and researchers can trace the Atchison Topeka and Santa Fe tracks to Glazier or locate rural sites like Locust Grove.
 - 1972 Map of Willow Creek, 1974 Print
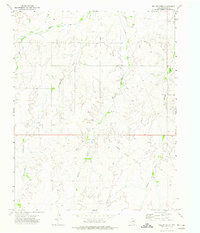 1972 Willow Creek1974 Print · USGSThe Texas Panhandle in the early seventies reveals a landscape transitioning between traditional ranching terrain and a productive energy frontier. Researchers can trace the industrial footprint of the Oil and Gas Field and landmarks like Wolf Creek and Willow Creek.
 - 1972 Map of Higgins South, 1974 Print
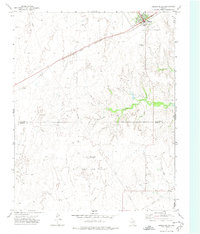 1972 Higgins South1974 Print · USGSLipscomb County at the start of the 1970s shows a landscape defined by the Atchison Topeka and Santa Fe and the energy sector. Genealogists and researchers can trace the town of Higgins, its Municipal Airfield, and the Feldman Oil and Gas Field.
 - 1972 Map of Lipscomb, 1974 Print
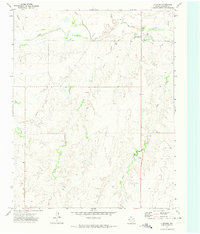 1972 Lipscomb1974 Print · USGSLipscomb and the surrounding Texas Panhandle high plains are documented here in the early 1970s. Local researchers can trace family sites at St Johns Cem or locate old ranching landmarks like Jack, Scott, and Little.
 - 1972 Map of Lipscomb SW, 1974 Print
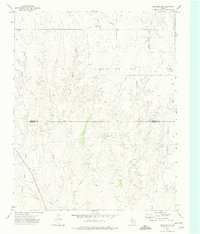 1972 Lipscomb SW1974 Print · USGSThe Texas Panhandle's energy landscape is captured here in the early seventies as the Kelln Oil Field expanded across the Lipscomb Co line. Genealogists and researchers can locate old sites like Robbins, Todd, and the Pumping Sta along the forks of Big Timber Creek.
 - 1972 Map of Darrouzett, 1975 Print
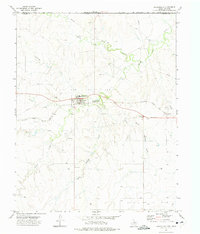 1972 Darrouzett1975 Print · USGSDarrouzett at the edge of the Texas Panhandle is shown here in the early 1970s, at the intersection of energy production and rail transit. Researchers can trace the local Cem, the Atchison Topeka and Santa Fe rail line, and the winding White Woman Creek.
 - 1972 Map of Coburn, 1975 Print
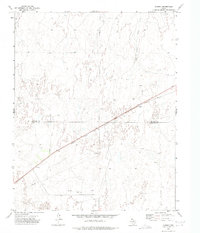 1972 Coburn1975 Print · USGSThe Texas Panhandle in the early 1970s shows a landscape defined by ranching and the rising energy industry. Researchers can trace the path of the Atchison Topeka and Santa Fe railroad through Coburn and locate numerous early Oil Wells.
 - 1972 Map of Gaylord, 1975 Print
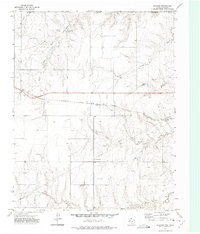 1972 Gaylord1975 Print · USGSThe High Plains of the Texas Panhandle met the Oklahoma border in the early seventies as energy infrastructure began to expand. Trace the Atchison Topeka and Santa Fe rail line through Gaylord or locate family roots at View Point Cem.
 - 1972 Map of Twin Grove, 1975 Print
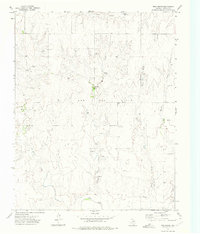 1972 Twin Grove1975 Print · USGSIn the Texas Panhandle during the early seventies, the energy industry and rugged hydrology defined the Lipscomb County landscape. Trace the distribution of Oil and Gas Field sites and natural landmarks like Twin Grove Spring and Gray Rock.
 - 1972 Map of Booker SE, 1976 Print
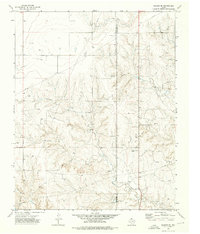 1972 Booker SE1976 Print · USGSThe Texas Panhandle in the early seventies shows an landscape shaped by energy production and prairie drainage. Genealogists and historians can trace the Oil and Gas Field infrastructure alongside local landmarks like Landing Strips and Kiowa Creek.
 - 1973 Map of Booker, 1975 Print
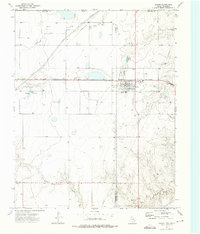 1973 Booker1975 Print · USGSThe high plains town of Booker is captured in the early 1970s, showing a landscape defined by the Atchison Topeka and Santa Fe railroad and energy production. Local researchers can trace family landmarks like Heart Cem, Kiowa Cem, and the Booker Independent Sch.
 - 1973 Map of Barton Creek, 1976 Print
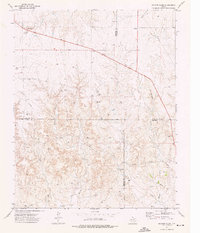 1973 Barton Creek1976 Print · USGSThe northern Panhandle at the height of the 1970s energy boom shows a landscape defined by cattle draws and resource extraction. Trace the industrial development of the four-county corner through Gas Wells, PIPELINES, and a local Pumping Sta along the banks of Barton Creek.
 - 1973 Map of Elmwood, 1976 Print
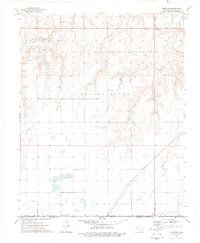 1973 Elmwood1976 Print · USGSThe Oklahoma Panhandle in the early 1970s is defined here by its intersection of major highways and an active energy economy. Family researchers and historians can locate Elmwood, Kirby Cem, and the industrial landscape of the Oil Fields.
 - 1973 Map of Lake Fryer NE, 1976 Print
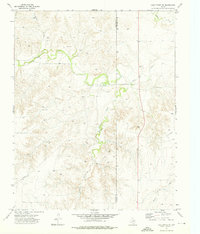 1973 Lake Fryer NE1976 Print · USGSOchiltree County is shown at the height of the mid-century energy boom, where oil and gas infrastructure meets traditional Texas ranchland. Trace the rural landscape along Wolf Creek and Gibson Creek to find isolated Gas Well sites and the local Gravel Pit.
Showing maps 1-25 of 27
Top cities of Lipscomb County
Frequently asked questions
- What are the different types of historical maps available for Lipscomb County?
- What is the oldest map of Lipscomb County?
- Where can I purchase historical maps of Lipscomb County for my home or office?
- Where can I download high-res historical maps of Lipscomb County?
- Are there historical topographic maps available for Lipscomb County?
- Is there historical aerial imagery available for Lipscomb County?
- Where are historical maps of Lipscomb County sourced from?