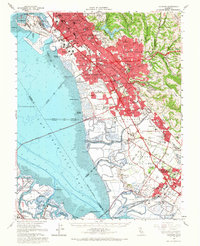
1959 Map of Hayward
USGS Topo · Published 1966About this map
Salt evaporators and tidal mudflats dominate the East Bay shoreline in this late-1950s record of industrial and suburban growth. The landscape is defined by the massive footprint of the Salt Evaporators stretching from Redwood Point south to Newark Slough, alongside the complex water networks of Alameda Creek and the Flood Control Channel. Inland, the rapid expansion of Hayward, San Leandro, and Castro Valley is evident, as residential grids push toward the foothills of Walpert Ridge.
Find a feature on this map
85 named features on this map. Tap any name to fly to it.
Don’t see what you’re looking for? This feature index may not catch every label — zoom into the map to look around manually.
Map Details
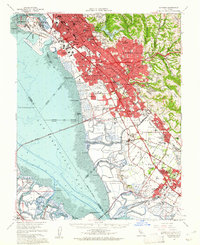
Editions of this 1959 Hayward Map
2 editions found
Other maps of this area
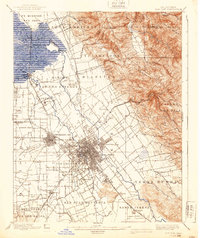
1889 · San Jose
USGS Topo · 1:62,500
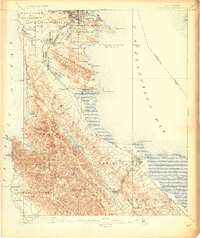
1892 · San Mateo
USGS Topo · 1:62,500
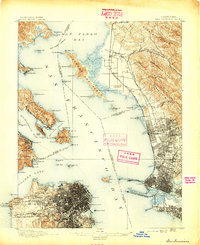
1895 · San Francisco
USGS Topo · 1:62,500
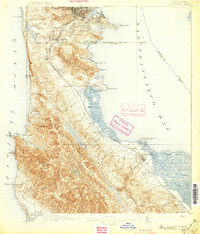
1896 · San Mateo
USGS Topo · 1:62,500
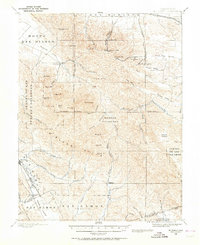
1896 · Mt. Diablo
USGS Topo · 1:62,500
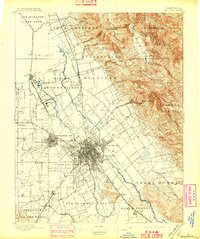
1897 · San Jose
USGS Topo · 1:62,500
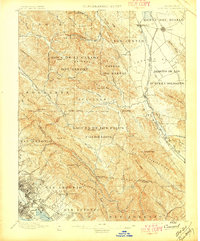
1897 · Concord
USGS Topo · 1:62,500
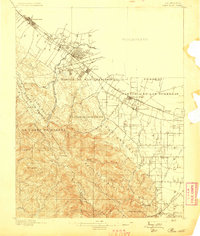
1897 · Palo Alto
USGS Topo · 1:62,500
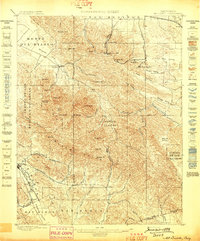
1898 · Mt. Diablo
USGS Topo · 1:62,500
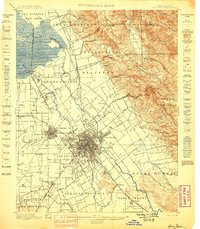
1899 · San Jose
USGS Topo · 1:62,500