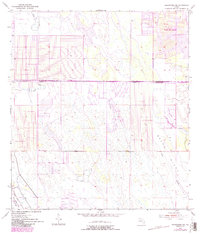
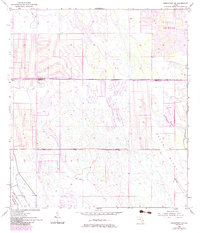
1953 Map of Indiantown NW
USGS Topo · Published 1983About this map
Allapattah Flats dominates the southwestern corner of this South Florida landscape, where the wetland terrain of Martin and St. Lucie counties begins its slow transition toward drainage and development. Originally surveyed in the early 1950s with updates from 1980, the map illustrates the emerging grid of Port St Lucie at the northeastern edge, showing a planned network of streets and designated Park areas amidst the native marshland. The artificial division of the landscape is punctuated by the St Lucie Co County Line Canal, which runs straight across the sheet, marking the jurisdictional boundary while facilitating water management. To the southeast, natural drainage patterns are still evident along Green Ridge and Cane Slough, where the elevation changes are subtle but significant for the local hydrology. This document records a critical era when residential expansion first began to square off against the wilder Spoil Bank and flats of the interior.
Find a feature on this map
10 named features on this map. Tap any name to fly to it.
Don’t see what you’re looking for? This feature index may not catch every label — zoom into the map to look around manually.
Map Details
Editions of this 1953 Indiantown NW Map
6 editions found
Other maps of this area
1948 · Palm City
USGS Topo · 1:24,000
1948 · Ankona
USGS Topo · 1:24,000
1950 · Ankona
USGS Topo · 1:24,000
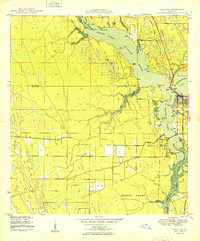
1950 · Palm City
USGS Topo · 1:24,000
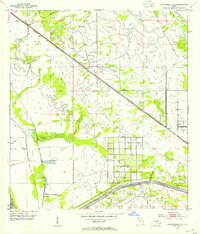
1953 · Okeechobee 4 SE
USGS Topo · 1:24,000
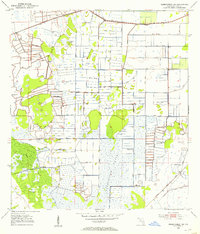
1953 · Okeechobee 1 SE
USGS Topo · 1:24,000
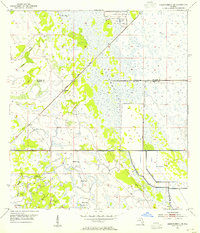
1953 · Okeechobee 4 NE
USGS Topo · 1:24,000
1953 · Indian Town SE
USGS Topo · 1:24,000
1953 · Indian Town NW
USGS Topo · 1:24,000
1953 · Fort Pierce SW
USGS Topo · 1:24,000