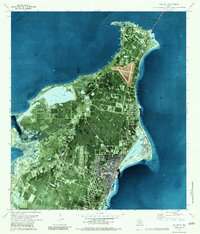
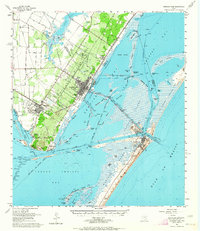
1979 Map of Rockport
USGS Topo · Published 1983About this map
Rockport and Fulton anchor this coastal landscape during the late 1970s, where the expansion of residential developments like Key Allegro (Frandolig Island) sits alongside traditional energy and transport infrastructure. The map depicts a transition from the urban grid of the town centers to the surrounding marshlands and waterways, including the prominent Salt Lake and Little Bay. Significant regional infrastructure is visible, including the County Airport and the Lyndon B Johnson Causeway spanning toward the Copano Bay Causeway State Park. Local life is recorded through the presence of Memorial Park, the Rockport Cem, and the Live Oak Country Club. Offshore, the maritime economy is evident with the Intracoastal Waterway and the West Fulton Beach Gas and Oil Field highlighting the region's reliance on both shipping and extraction.
Find a feature on this map
24 named features on this map. Tap any name to fly to it.
Don’t see what you’re looking for? This feature index may not catch every label — zoom into the map to look around manually.
Map Details
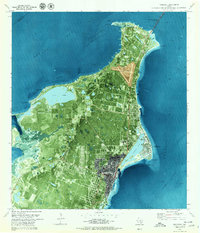
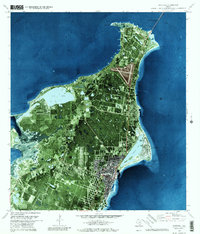
Editions of this 1979 Rockport Map
3 editions found
Other maps of this area
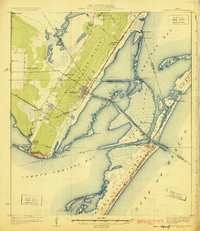
1925 · Aransas Pass
USGS Topo · 1:62,500
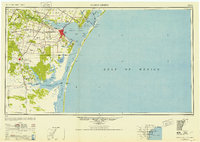
1950 · Corpus Christi
USGS Topo · 1:250,000
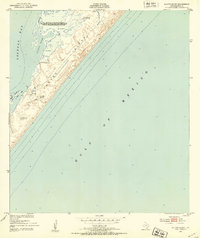
1951 · Allyns Bight
USGS Topo · 1:24,000
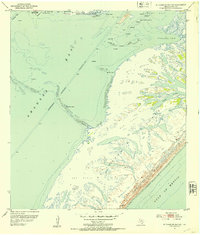
1952 · St. Charles Bay SW
USGS Topo · 1:24,000
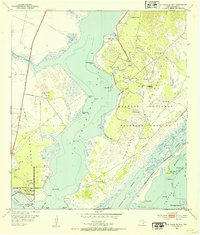
1952 · St. Charles Bay
USGS Topo · 1:24,000
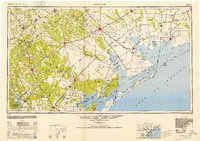
1953 · Beeville
USGS Topo · 1:250,000
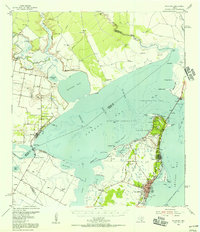
1954 · Rockport
USGS Topo · 1:62,500
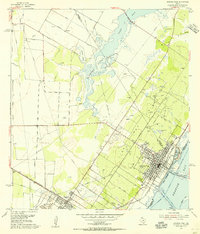
1954 · Aransas Pass
USGS Topo · 1:24,000
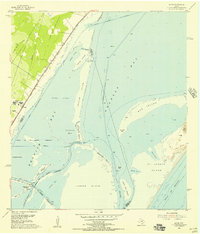
1954 · Estes
USGS Topo · 1:24,000
1954 · Aransas Pass
USGS Topo · 1:62,500