1900s (20th Century) Maps of Texas County, Oklahoma
Explore 58 historic maps of Texas County from the 1900s (20th Century). These maps offer a rare glimpse into what life looked like during the 1900s — showing old roads, neighborhoods, homes, and landmarks that have changed or disappeared over time.
Whether you're researching your family's past, planning a metal detecting trip, or studying how Texas County's landscape evolved across the 1900s, these high-resolution maps are a powerful tool for exploring the history of this region.
- Focus on a specific era: All maps on this page are from the 1900s, giving you a focused view of this time period.
- See what’s changed: Compare century-old streets, trails, and buildings to today's modern landscape using overlays and satellite layers.
- Research with precision: Use these maps for genealogy, historical research, land use analysis, or educational projects.
- View, download, or print: Maps are fully viewable online in high resolution, and can be downloaded or printed for your own records.
Start exploring Texas County's history through authentic maps from the 1900s. This is your window into the past.
Texas County, OK maps
(58)- 1954 Map of Perryton, 1966 Print
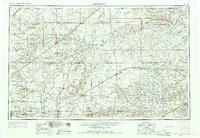 1954 Perryton1966 Print · USGSThe High Plains of the Texas and Oklahoma panhandles are shown during a period of steady growth in the mid-1950s. Genealogists and researchers can trace rail history and local landmarks like Panhandle A & M College, Spurlock Chapel, and the isolated Lord Station.3 unique versions available
 - 1954 Map of Dalhart, 1967 Print
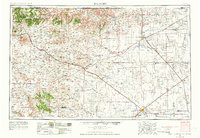 1954 Dalhart1967 Print · USGSThe High Plains at the junction of four states come alive in the mid-fifties, showing a landscape of rail-hub towns and cattle country. Trace the Old Santa Fe Trail or locate mid-century industrial sites like the Dry ice plant and Carbon Dioxide Works.2 unique versions available
 - 1958 Map of Perryton
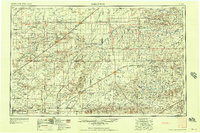 1958 Perryton1958 Print · USGSThe Oklahoma Panhandle and Texas borderlands come alive in this mid-century survey, showing the vital rail-and-ranch economy of the High Plains. Researchers can trace historic stops along the Chicago Rock Island and Pacific and locate rural landmarks like Bethel Church and Spurlock Chapel.
 - 1958 Map of Dalhart
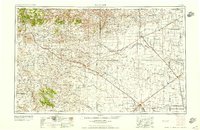 1958 Dalhart1958 Print · USGSThe High Plains of the tri-state border region come alive in this mid-century survey of the ranching and rail territory around the Texas Panhandle. Genealogists and historians can trace the paths of the Atchison Topeka & Santa Fe Ry, military outposts like Dalhart Air Force No 1, and early settlements such as Pasamonte and Texline.2 unique versions available
 - 1962 Map of Dalhart
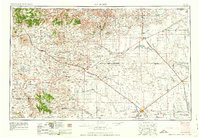 1962 Dalhart1962 Print · USGSThe High Plains and volcanic peaks of the tri-state area are shown in detail during the early sixties. Genealogists and historians can trace the rail corridors of the Fort Worth and Denver and find industrial sites like the Cactus Ordnance Works or the Beaver Meade & Englewood Grain Elevator.
 - 1962 Map of Hansford Camp, 1965 Print
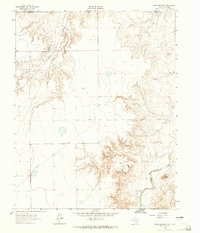 1962 Hansford Camp1965 Print · USGSThe High Plains of the Texas-Oklahoma border are captured in the early sixties as energy production reshaped the landscape. Genealogists and historians can trace the New Hope Cem and New Hope Sch near the wells of Hansford Camp.2 unique versions available
 - 1967 Map of Straight, 1968 Print
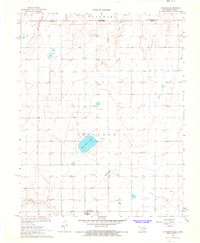 1967 Straight1968 Print · USGSThe Oklahoma-Kansas borderlands come into focus in the late 1960s, showing a landscape defined by the high plains energy industry. Genealogists and historians can locate the small settlement of Straight, the nearby Straight Landing Field, and Wild Horse Lake.
 - 1967 Map of Straight NE, 1968 Print
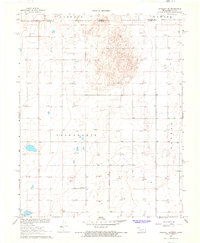 1967 Straight NE1968 Print · USGSThe Oklahoma Panhandle and Kansas border come alive in the late sixties as the energy economy transforms the agricultural plains. Genealogists and researchers can locate the Prairie Rose Community Center and trace the development of township lands in Friendship and Banner.
 - 1967 Map of Straight SW, 1968 Print
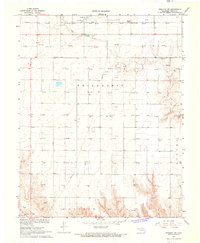 1967 Straight SW1968 Print · USGSThe Oklahoma Panhandle in the late sixties reveals an active energy landscape centered around the settlements of Straight and Mouser. Researchers can trace the mid-century petroleum economy through numerous Gas Wells and landmarks like the Landing Field.
 - 1967 Map of Optima, 1968 Print
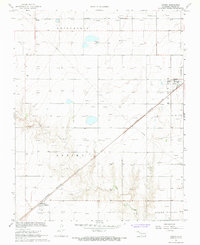 1967 Optima1968 Print · USGSThe Oklahoma Panhandle in the late sixties was a landscape defined by the energy boom and the rails. Trace the industrial footprint of Gas Wells and a Refinery along the Chicago Rock Island and Pacific railroad through Optima and Panoma.2 unique versions available
 - 1967 Map of Hooker, 1968 Print
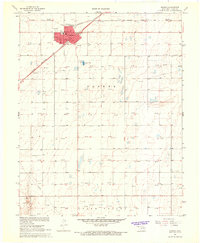 1967 Hooker1968 Print · USGSHooker stands at a crossroads of the Oklahoma Panhandle in the late sixties, where rail lines and energy development define the local landscape. Genealogists and researchers can trace the town grid from City Hall to the Hooker Cem or follow the Chicago Rock Island and Pacific railroad through the plains.
 - 1967 Map of Adams, 1968 Print
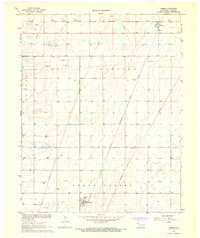 1967 Adams1968 Print · USGSTexas County, Oklahoma, is shown in the late sixties as an active hub of energy production and rail transport. Researchers can trace the path of the Chicago Rock Island and Pacific railroad and locate rural landmarks like Happy Cem and the settlement of Adams.
 - 1967 Map of Hooker NW, 1968 Print
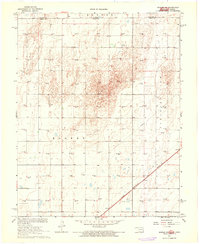 1967 Hooker NW1968 Print · USGSThe Oklahoma and Kansas borderlands are defined by energy production and heavy rail in the late sixties. Genealogists and industrial historians can trace the paths of the Chicago Rock Island and Pacific railroad and find dozens of active Gas Wells across Hooker.
 - 1967 Map of Tyrone, 1968 Print
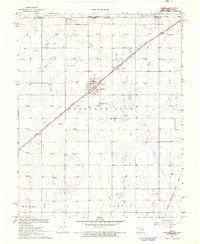 1967 Tyrone1968 Print · USGSTexas County, Oklahoma, was a landscape defined by the railroad and the oil field during the late sixties. Genealogists and local historians can trace the grid of section lines near Tyrone, locating the Tyrone Cem and the industrial hub at Fluor.2 unique versions available
 - 1968 Map of Hardesty, 1969 Print
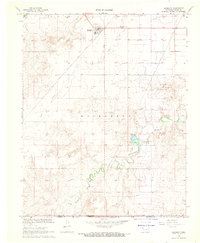 1968 Hardesty1969 Print · USGSThe Oklahoma Panhandle near the Texas border comes into focus during the late sixties, showing a landscape defined by ranching and resource extraction. Trace the local genealogy at Hartsville Cem or locate old industrial sites like the Caliche Pit and numerous Gas Wells.
 - 1968 Map of Optima Dam, 1969 Print
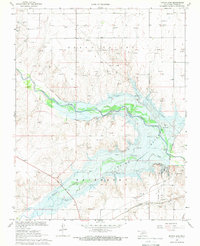 1968 Optima Dam1969 Print · USGSTexas County, Oklahoma, was undergoing a major landscape transformation in the late sixties as the valley prepared for a new reservoir. Researchers can trace the Optima Dam (Under Construction), the Chicago Rock Island and Pacific railroad, and local history at Hardesty Cem.
 - 1968 Map of Hardesty SE, 1969 Print
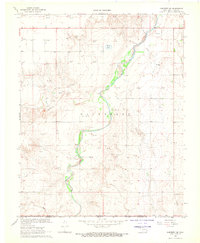 1968 Hardesty SE1969 Print · USGSThe Oklahoma and Texas borderlands in the late sixties were defined by energy production and quiet rural outposts. Researchers can trace the landscape of oil and gas alongside local landmarks like Range Cem, Webb Lake, and Bethel Ch.
 - 1968 Map of Hardesty NE, 1969 Print
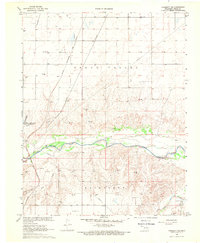 1968 Hardesty NE1969 Print · USGSTexas County, Oklahoma, is captured here in the late sixties during a period of transition for the High Plains. You can trace the path of the Chicago Rock Island and Pacific railroad and locate landmarks like the Gibson Assembly Camp and Optima Reservoir.
 - 1968 Map of Guymon, 1970 Print
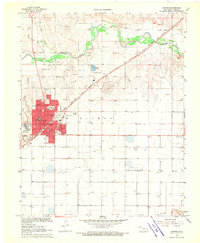 1968 Guymon1970 Print · USGSGuymon sits at a cultural and industrial crossroads in the Oklahoma Panhandle during the late sixties, where the railroad meets the river. Researchers can locate local landmarks like Elmhurst Cemetery, Academy School, and the KGYN Radio Tower.2 unique versions available
 - 1968 Map of Guymon SW, 1970 Print
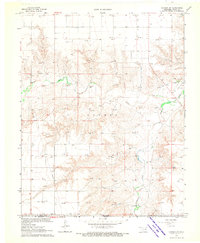 1968 Guymon SW1970 Print · USGSThe Oklahoma Panhandle in the late sixties shows a landscape of ranching and emerging energy production. Researchers can trace land use through features like Hitch Ranch, early Landing Strips, and a local Cem along the banks of Coldwater Creek.
 - 1968 Map of Guymon NE, 1970 Print
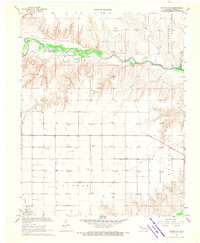 1968 Guymon NE1970 Print · USGSThe Oklahoma Panhandle is seen here during the late 1960s, showing a landscape defined by ranching and the burgeoning energy industry. Researchers can trace rural landmarks like the Banner Cem and multiple Caliche Pits across Grand Valley.
 - 1968 Map of Guymon SE, 1970 Print
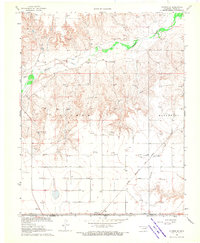 1968 Guymon SE1970 Print · USGSThe Oklahoma Panhandle is shown in the late 1960s as the energy and cattle industries shaped the state line. Researchers can trace the path of the Chicago Rock Island and Pacific railroad through Hitchland and locate numerous mid-century Gas Wells and a Landing Strip.
 - 1971 Map of Griggs NE, 1973 Print
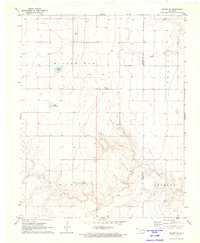 1971 Griggs NE1973 Print · USGSThe Oklahoma Panhandle in the early seventies shows a landscape of cattle ranching and early energy development. Researchers can find family burial sites at Hutsell Cem and trace the paths of Tepee Creek and Sand Creek through the open plains.
 - 1971 Map of Griggs, 1973 Print
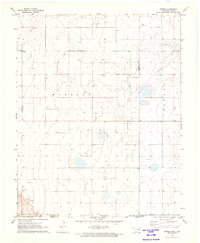 1971 Griggs1973 Print · USGSThe Oklahoma Panhandle is captured here in the early seventies, centered on the small community of Griggs. Researchers can trace the industrial footprint of the Marella Oil and Gas Field and the complex border between Cimarron and Texas counties.
 - 1971 Map of Sturgis, 1973 Print
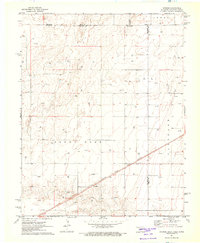 1971 Sturgis1973 Print · USGSThe Oklahoma Panhandle in the early seventies centers on the rail-side community of Sturgis and the surrounding energy fields. Local researchers can trace the Atchison Topeka and Santa Fe railroad corridor past Goff and the local Roadside Park.
Showing maps 1-25 of 58
Top cities of Texas County
- Guymon historical maps
- Hooker historical maps
- Goodwell historical maps
- Tyrone historical maps
- Texhoma, OK historical maps
- Optima historical maps
See more
Frequently asked questions
- What are the different types of historical maps available for Texas County?
- What is the oldest map of Texas County?
- Where can I purchase historical maps of Texas County for my home or office?
- Where can I download high-res historical maps of Texas County?
- Are there historical topographic maps available for Texas County?
- Is there historical aerial imagery available for Texas County?
- Where are historical maps of Texas County sourced from?